Olympic Games Analysis


Business Problem and Request
The project’s challenge for this data analyst is stated below. This has been used on a constant basis to guarantee that the correct data has been picked, transformed, and used in the data visualization that will be presented to business users.
“As a data analyst at a news organisation, you are asked to show data that will assist readers in understanding how countries have historically performed in the summer Olympic Games.”
You also know that there is a focus on details about the competition, so if you come across something noteworthy, don’t be afraid to bring it up.
The primary task remains to display historical performance for many countries, with the option to select your own.”
Data Collection & Table Structures
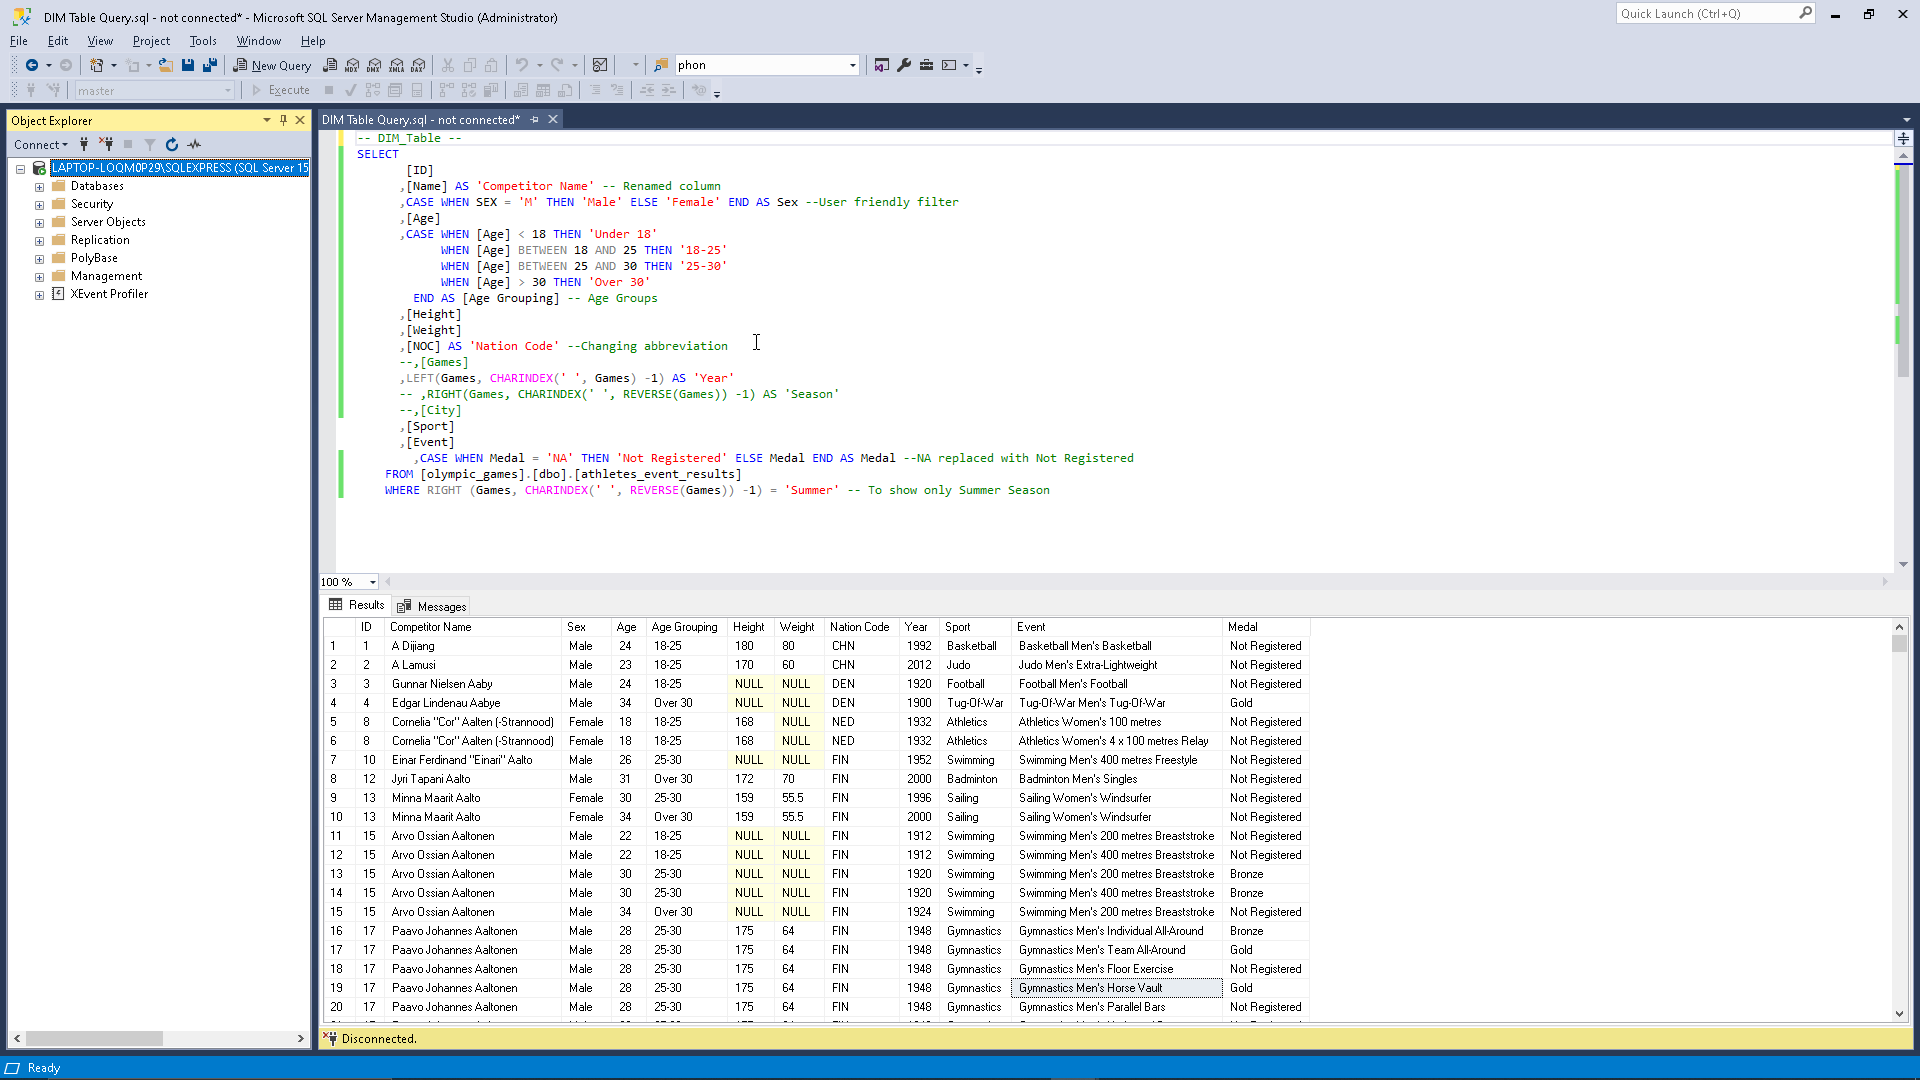
The required data was initially entered into a SQL database and then transformed using the transformations shown below.
Olympic games View
					-- Olymic_Games_Table --
SELECT
	   [ID]
      ,[Name] AS 'Competitor Name' -- Renamed column
      ,CASE WHEN SEX = 'M' THEN 'Male' ELSE 'Female' END AS Sex --User friendly filter
      ,[Age]
	  ,CASE WHEN [Age] < 18 THEN 'Under 18'
			WHEN [Age] BETWEEN 18 AND 25 THEN '18-25'
			WHEN [Age] BETWEEN 25 AND 30 THEN '25-30'
			WHEN [Age] > 30 THEN 'Over 30'
		END AS [Age Grouping] -- Age Groups
      ,[Height]
	  ,[Weight]
      ,[NOC] AS 'Nation Code' --Changing abbreviation
      --,[Games]
      ,LEFT(Games, CHARINDEX(' ', Games) -1) AS 'Year'
	  -- ,RIGHT(Games, CHARINDEX(' ', REVERSE(Games)) -1) AS 'Season'
	  --,[City]
      ,[Sport]
      ,[Event]
		,CASE WHEN Medal = 'NA' THEN 'Not Registered' ELSE Medal END AS Medal --NA replaced with Not Registered
	FROM [olympic_games].[dbo].[athletes_event_results]
	WHERE RIGHT (Games, CHARINDEX(' ', REVERSE(Games)) -1) = 'Summer' -- To show only Summer Season
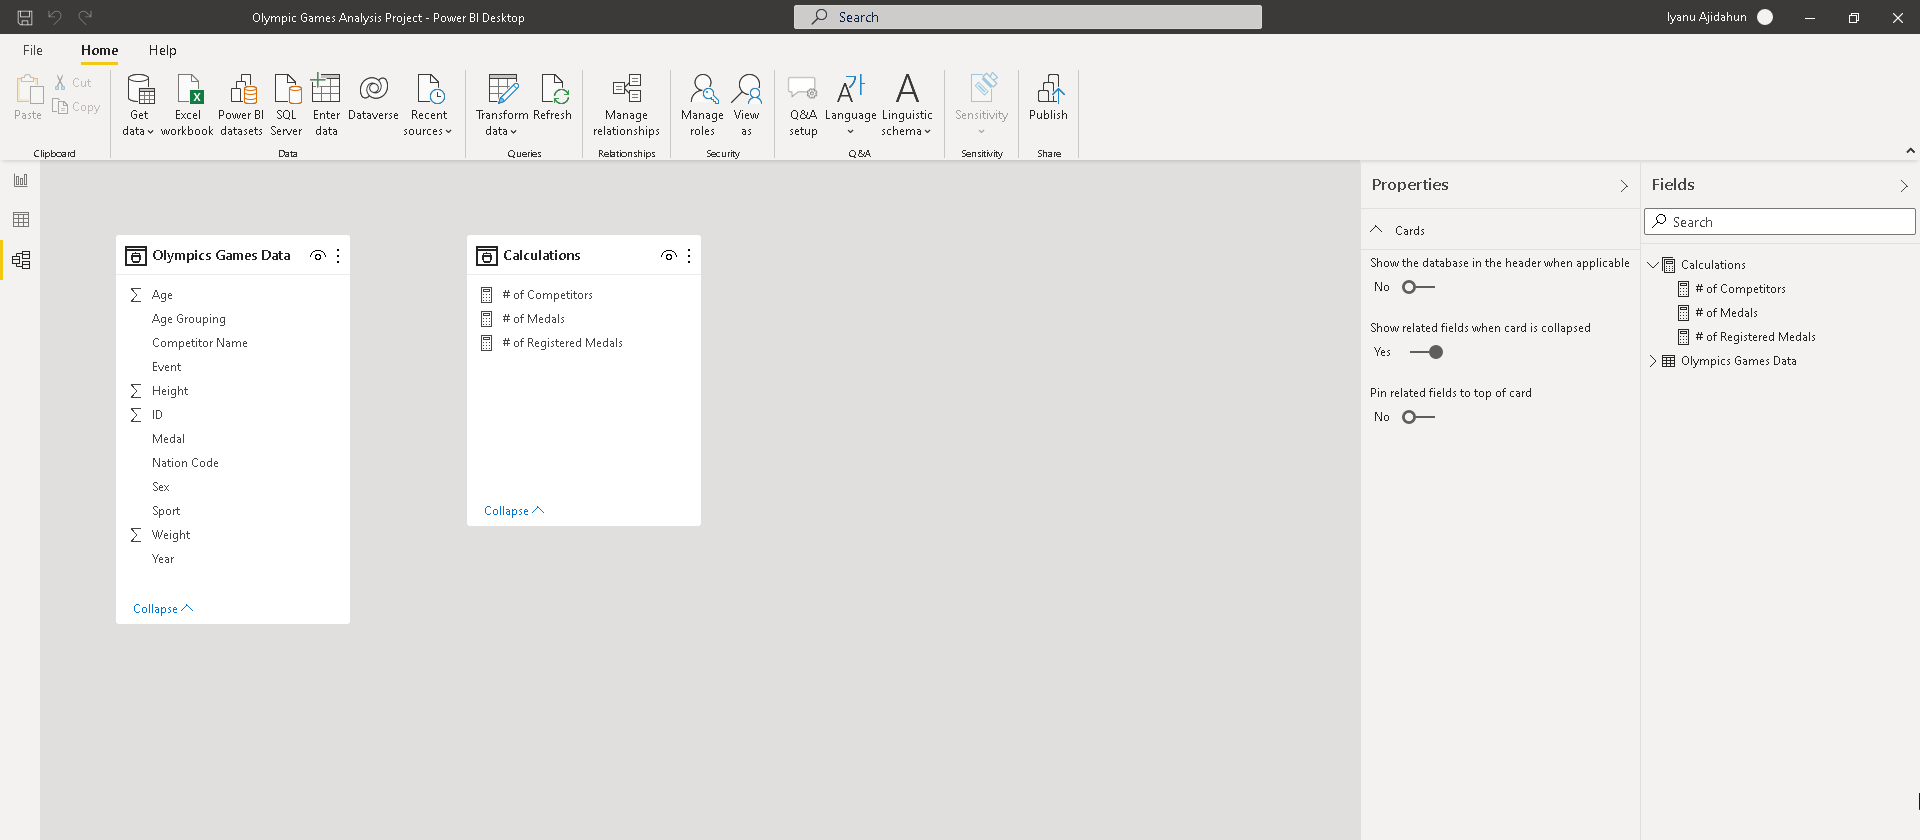
Data Model
The data model built in Power BI is one table because this is a view that combines dimensions and facts. The query from the previous phase was directly loaded.

Calculations
Using DAX (Data Analysis Expressions), the following calculations were created in the Power BI reports . To reduce the amount of coding, measure re-use (measure branching) was emphasised:
The number of competitors:
# of Competitors = DISTINCTCOUNT( ‘Olympic Data'[ID] )
# of Medals = COUNTROWS( ‘Olympic Data’ )
# Of Medals (Registered) = CALCULATE( [# of Medals], FILTER( ‘Olympic Data’, ‘Olympic Data'[Medal] = “Bronze” || ‘Olympic Data’ [Medal] = “Gold” || ‘Olympic Data'[Medal] = “Silver” ))
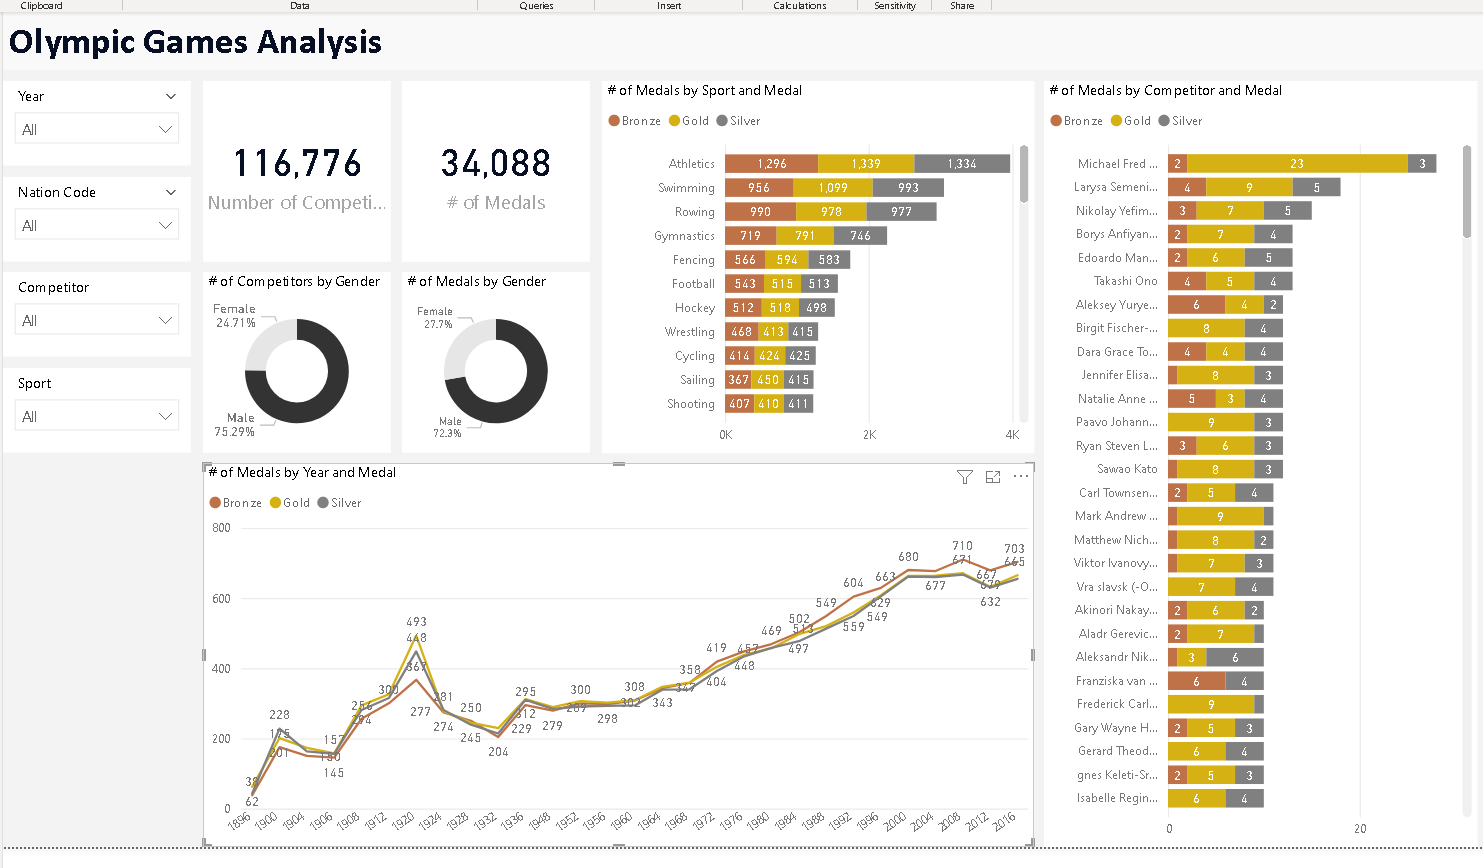
Olympic Games Analysis Dashboard
The completed dashboard includes visuals and filters that allow end-users to explore the summer games through history easily. Some options include filtering by period (year), nation code (to focus on one country), or looking at a competition or specific sports over time.
